
Updated: 5 May, 2025
One of the first freedoms students experience at university is the choice to attend class—or not. With no one taking attendance at the door, skipping lectures becomes a tempting option. But just how often do students actually stay away? Is low attendance as common as people assume?
To answer that, we analyzed real attendance data from 70 university courses delivered at institutions around the world, most of them based in the United States. These courses weren’t hand-picked for high engagement or cherry-picked from one department. They were selected based on clear criteria: a minimum of 20 students, at least 10 class sessions, and full attendance tracking across the entire course.
Why does this matter? Because class attendance is more than a formality. Studies consistently link it to stronger academic performance, better retention, and deeper student engagement. And yet, it’s a topic that rarely gets examined with real data. This article helps fill that gap.
We’ll break down average attendance rates, compare trends across countries, and look at whether course structure—like the number of sessions or class size—affects who shows up. If you're also wondering how institutions measure attendance today, you may find this overview of tracking methods useful.
Let’s explore what university attendance really looks like.
How We Collected the Data
To understand how often university students actually attend class, we analyzed real-world attendance data from 70 completed university courses. All of this data was collected directly from users of the Attendance Radar app, which tracks attendance digitally using secure, automated check-ins. The data was fully anonymized and aggregated for this analysis.
To ensure consistency and meaningful comparisons, we only included courses that met all of the following criteria:
- At least 10 class sessions
Short or irregular courses were excluded to ensure reliable patterns. - A minimum of 20 students
Very small courses can distort the data, so we set a floor on enrollment. - Complete attendance tracking
Each session of each course had to include recorded attendance—no gaps or partial data. - The course had to be completed
Ongoing or canceled courses were excluded.
This filtered dataset includes courses from around the world, with the majority based in the United States. Each record captures the number of students, number of sessions, and the overall attendance rate for a course.
By focusing on courses using a consistent digital tracking method like Attendance Radar, we eliminate guesswork and ensure that the insights drawn reflect actual student behavior, not perception.
What the Global Data Reveals
So, what does the attendance data actually tell us?
Across all 70 university courses, the average attendance rate was 68.7%. That means students were present in roughly two out of every three class sessions. While this may seem lower than expected, it’s important to remember that this average includes a wide range of institutions, countries, and course formats.
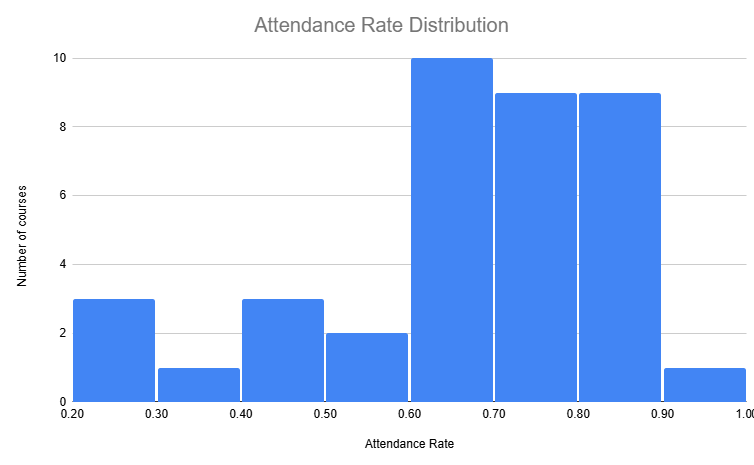
Let’s start by looking at the distribution of attendance rates across all courses.
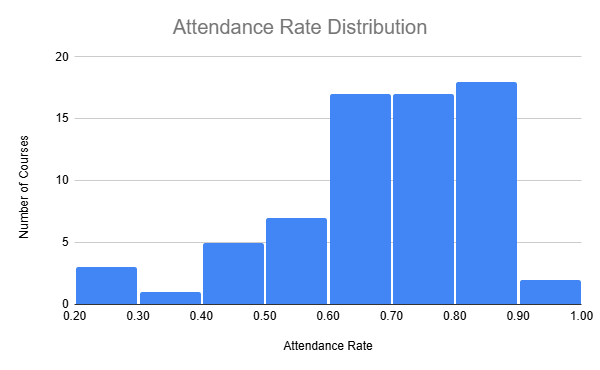
As shown in the chart, attendance is spread across a broad spectrum. The most common attendance rates fall between 60% and 90%, with only a few courses dropping below the 50% mark. These lower values may reflect specific challenges—like early morning sessions, large class sizes, or a lack of mandatory attendance policies.
Descriptive Statistics at a Glance
| Descriptive Statistics | |
| Max | 0.921 |
| Upper Quartile | 0.807 |
| Median | 0.719 |
| Lower Quartile | 0.618 |
| Min | 0.220 |
| Mean | 0.687 |
| Count | 70 |
This wide distribution suggests a strong variance in attendance habits. Some courses maintain consistently high engagement, while others struggle to get half the students through the door.
Does Class Size Affect Attendance?
To explore this, we looked at whether the number of students in a course had any relationship with how often students attended.
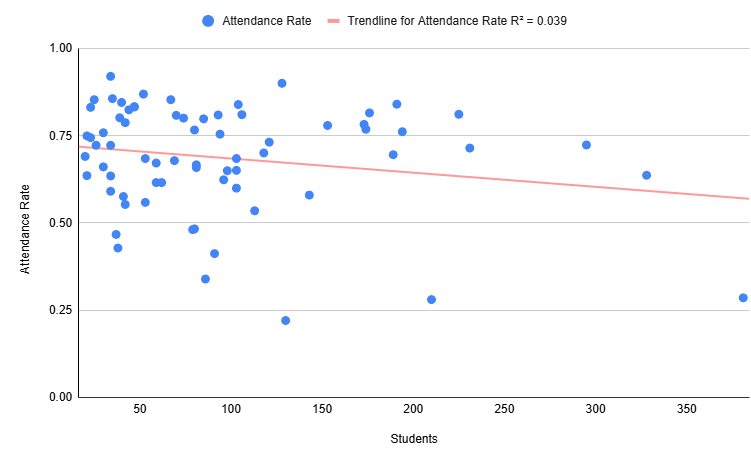
As you can see, the graph shows no strong correlation between class size and attendance (R² = 0.039). Courses with 30 students and those with 200+ showed similar attendance patterns. This challenges the assumption that large classes automatically lead to disengagement.
Does the Number of Class Sessions Matter?
Next, we looked at whether longer courses—those with more sessions—saw better or worse attendance.
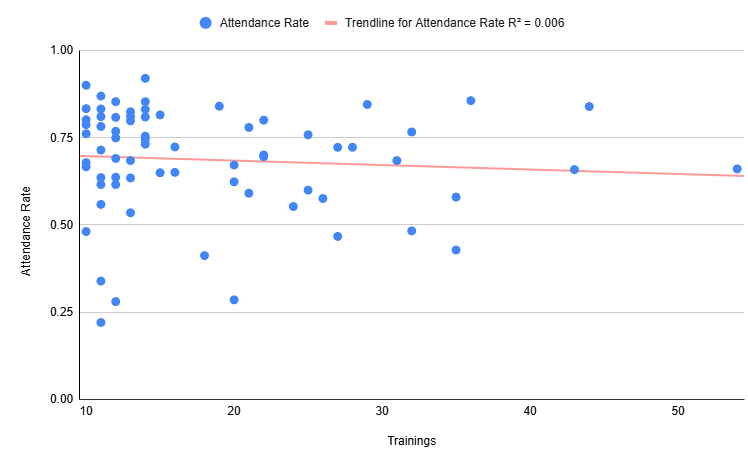
Once again, the data shows virtually no correlation (R² = 0.006). Some of the highest-attended courses had over 30 sessions, while others with similar structures struggled with lower turnout. Duration alone doesn’t seem to influence attendance in any consistent way.
A Global Mix of Institutions
The dataset spans institutions in over a dozen countries. While the majority of courses come from the United States, we also included data from Italy, the Philippines, Thailand, India, Kuwait, and others.
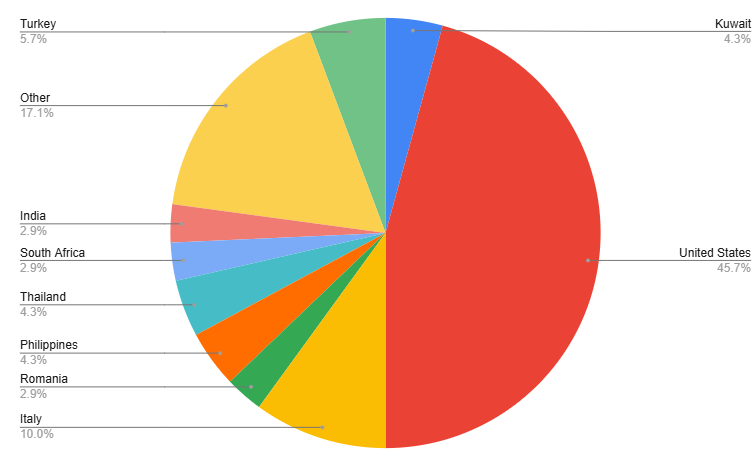
This international perspective helps reveal broader patterns, which we’ll explore more closely in the next two sections: one focused on U.S. universities, and one on the rest of the world.
Zooming In: Attendance at U.S. Universities
Out of the 70 courses in our dataset, 32 were offered by universities in the United States. These courses provide an interesting subset, not only because of their volume but also because of their generally higher attendance rates.
The average attendance rate for U.S.-based courses was 71.5%, compared to 68.7% globally. In other words, students in U.S. universities attended just over seven out of ten sessions on average.
What the Numbers Show

The histogram reveals a tighter distribution toward the higher end of the attendance spectrum. Most U.S. courses fall between 65% and 90% attendance, with very few dipping below 60%. Notably, the lowest U.S. attendance rate in the dataset was 42.8%, which is still significantly above the global minimum of 22.0%.
| Descriptive Statistics | |
| Max | 0.901 |
| Upper Quartile | 0.811 |
| Median | 0.728 |
| Lower Quartile | 0.647 |
| Min | 0.428 |
| Mean | 0.715 |
| Count | 32 |
Compared to the global data, the U.S. median and quartiles are all higher, showing a slight but consistent difference.
Does Class Size Matter in the U.S.?
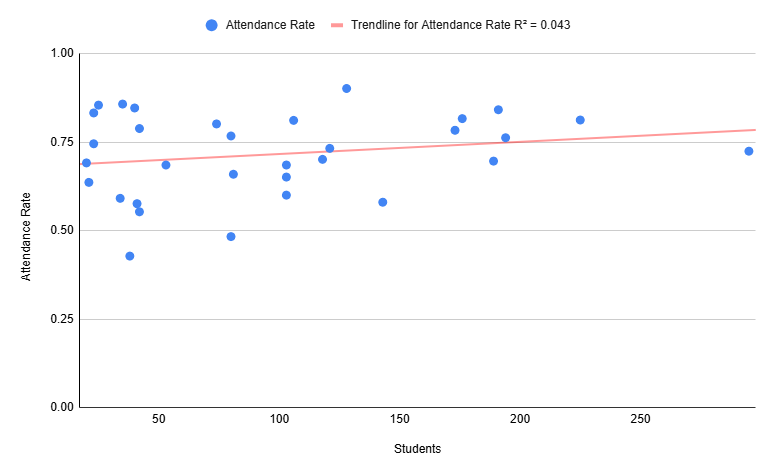
Interestingly, the U.S. data shows a slight positive trend (R² = 0.043), suggesting that in some cases, larger classes may have marginally better attendance. This is counterintuitive and could point to more structured formats or institutional policies in place for high-enrollment courses.
The Effect of Course Length
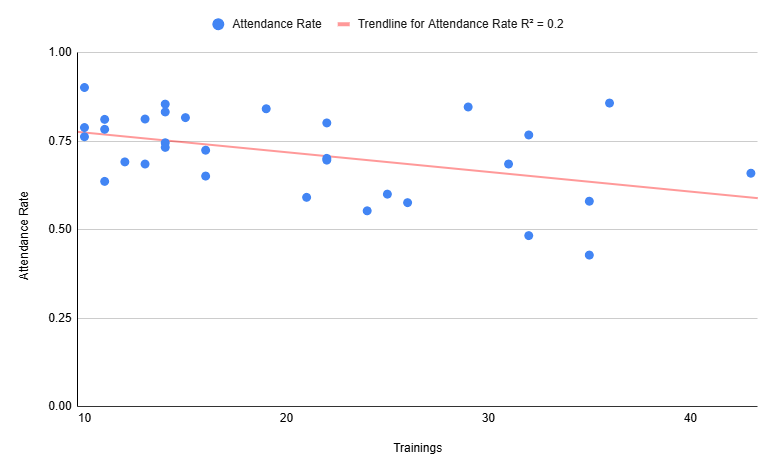
In contrast to the global data, the U.S. courses revealed a mild negative correlation between the number of class sessions and attendance (R² = 0.2). This implies that longer courses might see lower average attendance over time, possibly due to student fatigue or increased flexibility in course requirements.
This raises a subtle but important point: while attendance is generally higher in U.S. institutions, it doesn’t mean it’s evenly sustained. Even committed students may disengage in longer or less dynamic courses.
A Broader Look: Attendance Outside the U.S.
The remaining 38 courses in our dataset were delivered by universities outside the United States. These institutions span Europe, Asia, the Middle East, and Africa, providing a valuable global view of attendance behaviors in higher education.
On average, attendance rates in non-U.S. courses were slightly lower, with a mean of 66.3% compared to 71.5% in the U.S. This suggests a small but noticeable difference in how often students attend class internationally.
A Wider Spread of Behaviors
The histogram reveals that non-U.S. attendance rates are more widely spread, with more courses falling below the 60% mark. In fact, the lowest attendance rate in the entire dataset—just 22%—comes from a non-U.S. course. However, this group also includes the course with the highest recorded attendance rate of 92.1%, indicating both extremes are present.
| Descriptive Statistics | |
| Max | 0.921 |
| Upper Quartile | 0.801 |
| Median | 0.697 |
| Lower Quartile | 0.616 |
| Min | 0.220 |
| Mean | 0.663 |
| Count | 38 |
Although the median and mean are slightly lower than their U.S. counterparts, many non-U.S. courses maintain strong attendance, especially those with smaller groups or structured formats.
Larger Classes, Lower Attendance
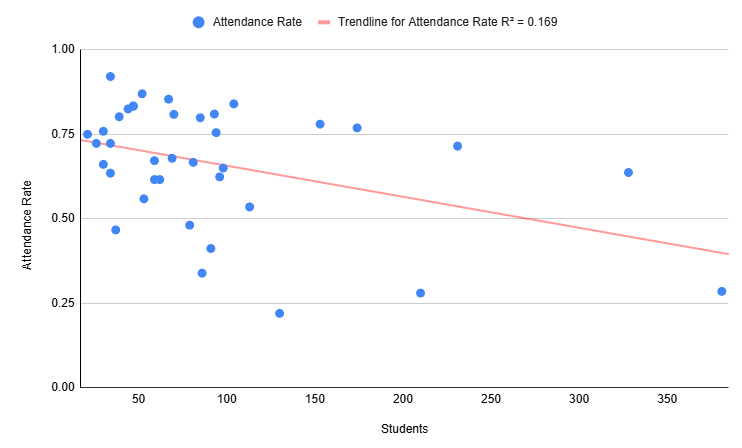
The most notable pattern in the non-U.S. data is a moderate negative correlation between class size and attendance (R² = 0.169). This trend suggests that larger international classes tend to see lower attendance, perhaps due to less individual accountability or weaker participation incentives.
This finding aligns with some of the discussion in "Millennials and Gen Z: Different Attendance Habits", where generational and cultural differences were shown to shape attendance behaviors differently across contexts.
Session Count Makes No Difference
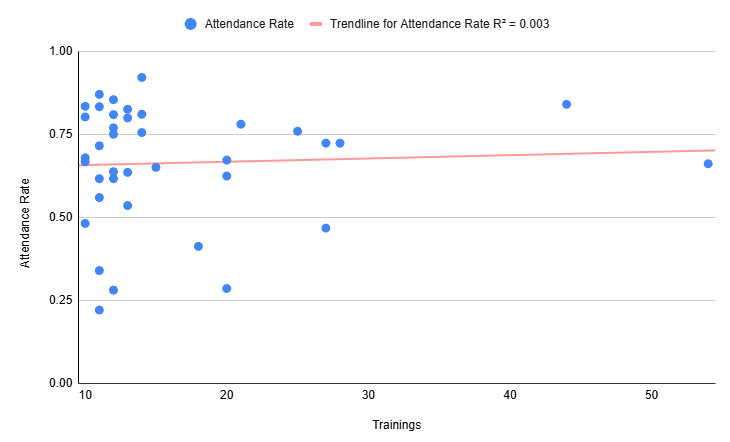
Unlike the U.S. subset, the number of sessions in a course appears to have no effect on attendance outside the U.S. (R² = 0.003). Whether a course had 10 sessions or 40, students tended to follow similar attendance patterns. This could suggest that other factors—such as class format or teaching style—play a bigger role than duration.
What Influences Whether Students Show Up?
Now that we've explored both U.S. and non-U.S. data, a few patterns begin to emerge. While attendance varies widely from course to course, certain structural and contextual factors appear to influence who shows up — and who doesn't. You can learn more about this in our article "A Deep Dive on the Causes of Student Absenteeism".
1. Class Size Has Mixed Effects
Across all countries, there's no strong universal relationship between class size and attendance. However, in the non-U.S. dataset, we observed a moderate drop in attendance as class size increases. This may suggest that larger lectures outside the U.S. are more anonymous, with fewer participation incentives or personal accountability.
In contrast, U.S. universities showed a very slight positive correlation, possibly due to stricter attendance policies or grading structures that reward participation, especially in high-enrollment core courses.
2. Session Count Matters — Sometimes
U.S. courses showed a mild decline in attendance as the number of sessions increased. This may reflect student fatigue or a lack of consistent engagement throughout the semester. Internationally, however, the number of sessions didn’t seem to affect attendance at all. Duration alone doesn’t predict turnout.
3. Tracking Methods Make a Difference
All of the courses in this study used Attendance Radar, a digital tool that ensures attendance is captured consistently and reliably across sessions. Tools like these offer a clearer picture of actual behavior than manual sign-ins or headcounts — and they reduce errors.
You can learn more about the various attendance tracking methods (and why consistency matters) in this guide on how to check attendance effectively.
4. Course Engagement and Teaching Style
While our dataset doesn't directly measure teaching quality or interactivity, it’s well established that courses with engaging, participatory formats tend to draw more students. Articles like "The Best Student Engagement Strategies" offer insight into how course design can improve turnout, regardless of geography.
Should We Be Concerned About These Attendance Rates?
At first glance, an average attendance rate of around 69% might raise alarms. Shouldn't students be attending more regularly—especially when tuition costs are high and academic success is on the line?
It’s true that several studies have shown a positive relationship between class attendance and academic performance. Students who attend class regularly tend to achieve better grades, stay enrolled longer, and report a stronger sense of engagement. This is particularly true in courses that are discussion-based, participatory, or cumulative in nature.
But it's also important to acknowledge the nuance behind the numbers.
Some Absences Are Strategic, Not Problematic
In modern university settings, students often balance academics with jobs, family responsibilities, and mental health needs. Skipping a lecture doesn't always signal disengagement. For many students, online materials and recorded sessions fill in the gaps when physical attendance isn't possible—or needed.
Articles like "Should Attendance Be Mandatory in College?" dive deeper into this debate, weighing the benefits of structure against the importance of flexibility.
Context Matters
Attendance alone doesn’t tell the whole story. Some students may attend every class and remain passive, while others might skip a few sessions but stay highly engaged through assignments and participation when present.
Moreover, some courses are better suited to self-paced or asynchronous learning. In those cases, strict attendance may not be the best metric for success.
Conclusion: What the Data Really Says
So, do university students attend class? The answer is: mostly, yes — but not always, and not equally.
Across 70 courses tracked using Attendance Radar, the average attendance rate hovered around 69%. Students in the United States showed slightly higher attendance (72%) than their international peers (66%), but wide variation existed in both groups. Some courses achieved near-perfect attendance, while others struggled to get even half the class in the room.
Interestingly, factors like class size and course length didn’t have a consistent impact across all regions. In the U.S., longer courses saw some decline in attendance, while internationally, larger class sizes correlated with lower turnout. But beyond structure, a more important factor may be how the course is delivered—whether it's engaging, participatory, and perceived as valuable.